Indian Status of Mango
(Area, Production and Productivity-Growth Pattern)
The production scenario of different fruits in India indicates that all the fruits occupied 6480 thousand ha area with 92846 thousand MT production and 14.3 MT/ha productivity during 2016-17. The total allocation to the fruits in the country has been increased from 6235 to 6480 thousand ha over the previous year, while the total production of fruits has also been increased from 89512 to 92846 thousand MT (Table 1).
Table-1: Area and Production of Fruit Crops (Area in ‘000 ha, Production in ‘000 MT and Productivity = MT/ha)
|
Fruits |
2014-15 |
2015-16 |
2016-17 |
||||||
| Area | Production | Productivity | Area | Production | Productivity | Area | Production | Productivity | |
| Almond | 21 | 10 | 0.5 | 12 | 8 | 0.7 | 12 | 8 | 0.7 |
| Aonla/Gooseberry | 95 | 1173 | 12.3 | 88 | 972 | 11.0 | 91 | 989 | 10.9 |
| Apple | 319 | 2134 | 6.7 | 277 | 2521 | 9.1 | 277 | 2242 | 8.1 |
| Banana | 822 | 29221 | 35.5 | 841 | 29135 | 34.6 | 858 | 29163 | 34.0 |
| Ber | 42 | 401 | 9.5 | 44 | 425 | 9.7 | 49 | 481 | 9.8 |
| Citrus | 953 | 11655 | 12.2 | 1024 | 11581 | 11.3 | 1055 | 12746 | 12.1 |
| Custardapple | 30 | 228 | 7.6 | 37 | 298 | 8.1 | 44 | 367 | 8.3 |
| Grapes | 123 | 2823 | 23.0 | 122 | 2590 | 21.2 | 136 | 2683 | 19.7 |
| Guava | 246 | 3994 | 16.2 | 255 | 4048 | 15.9 | 262 | 3648 | 13.9 |
| Jackfruit | 118 | 2088 | 17.7 | 151 | 1732 | 11.5 | 156 | 1826 | 11.7 |
| Kiwi | 5 | 8 | 1.6 | 4 | 11 | 2.8 | 4 | 11 | 2.8 |
| Litchi | 85 | 528 | 6.2 | 90 | 559 | 6.2 | 92 | 583 | 6.3 |
| Mango | 2163 | 18527 | 8.6 | 2209 | 18643 | 8.4 | 2263 | 19687 | 8.7 |
| Muskmelon | 42 | 863 | 20.5 | 45 | 935 | 20.8 | 47 | 962 | 20.5 |
| Papaya | 115 | 4913 | 42.7 | 132 | 5667 | 42.9 | 136 | 6108 | 44.9 |
| Passion Fruit | 19 | 129 | 6.8 | 13 | 78 | 6.0 | 14 | 79 | 5.6 |
| Peach | 19 | 97 | 5.1 | 18 | 107 | 5.9 | 18 | 107 | 5.9 |
| Pear | 42 | 303 | 7.2 | 40 | 323 | 8.1 | 40 | 312 | 7.8 |
| Pican nut | 1 | 0 | 0.0 | 1 | 1 | 1.0 | 1 | 1 | 1.0 |
| Pineapple | 116 | 1984 | 17.1 | 110 | 1924 | 17.5 | 121 | 2038 | 16.8 |
| Plum | 23 | 72 | 3.1 | 22 | 82 | 3.7 | 22 | 76 | 3.5 |
| Pomegranate | 181 | 1789 | 9.9 | 197 | 2306 | 11.7 | 209 | 2442 | 11.7 |
| Sapota | 106 | 1339 | 12.6 | 107 | 1294 | 12.1 | 107 | 1285 | 12.0 |
| Strawberry | 1 | 8 | 8.0 | 1 | 5 | 5.0 | 1 | 5 | 5.0 |
| Walnut | 115 | 238 | 2.1 | 92 | 229 | 2.5 | 92 | 228 | 2.5 |
| Watermelon | 84 | 2049 | 24.4 | 95 | 2325 | 24.5 | 101 | 2480 | 24.6 |
| Others | 349 | 2938 | 8.4 | 275 | 2386 | 8.7 | 272 | 2289 | 8.4 |
| Total Fruits | 6235 | 89512 | 14.4 | 6302 | 90185 | 14.3 | 6480 | 92846 | 14.3 |
Source: Indian Horticulture Database
The area and production of mango has been almost continuously increases over the years (Table 2). The area under mango cultivation was 1077.6 thousand ha during 1991-92 which reaches up to 2516 thousand ha in 2013-14 and recorded 2262.8 thousand ha in 2016-17. However, the production has been fluctuating drastically. During 1991-92, the total production was 8715.6 thousand MT which was increased up to 13997 thousand MT in 2007-08. During 2008-09 the production was declined from 13997 thousand MT to 12750 thousand MT. From 2009-10 there is continuous increase in the mango production (15026.7 thousand MT) to 2016-17 (19686.9 thousand MT). A total 109.99 % increase in area under mango cultivation has been recorded from 1991-92 to 2014-15 while, 125.88 % increase in production was recorded during the same period. However, productivity has been fluctuating drastically from 1991-92 to 2014-15. The productivity of 8.1 MT/ha was recorded during 1991-12 whereas, it was declined up to 5.5 MT/ha in 2008-09 and again increased up to 8.5 MT/ha in 2014-15 and reached up to maximum productivity of 8.7 MT/ha in 2016-17. There was overall increase of 7.41 % in productivity of mango from 1991-92 to 2014-15.
| Year | Mango Area | % of Total Fruit Area | Production | % of Total Fruit Production | Productivity |
| 1991-92 | 1077.6 | 37.49 | 8715.6 | 30.44 | 8.1 |
| 2001-02 | 1575.8 | 39.30 | 10020.2 | 23.30 | 6.4 |
| 2002-03 | 1623.4 | 42.86 | 12733.2 | 28.17 | 7.8 |
| 2003-04 | 1906.7 | 40.91 | 11490 | 25.01 | 6 |
| 2004-05 | 1970.4 | 39.03 | 11829.7 | 23.26 | 6 |
| 2005-06 | 2080.7 | 39.08 | 12663.1 | 22.88 | 6.1 |
| 2006-07 | 2154 | 38.78 | 13734 | 23.06 | 6.4 |
| 2007-08 | 2201 | 37.58 | 13997 | 21.34 | 6.4 |
| 2008-09 | 2309 | 37.85 | 12750 | 18.62 | 5.5 |
| 2009-10 | 2312.3 | 36.53 | 15026.7 | 21.01 | 6.5 |
| 2010-11 | 2297 | 35.99 | 15188 | 20.28 | 6.6 |
| 2011-12 | 2378.1 | 35.47 | 16196.4 | 21.19 | 6.8 |
| 2012-13 | 2500 | 35.81 | 18002.4 | 22.15 | 7.2 |
| 2013-14 | 2516 | 34.87 | 18431.3 | 20.71 | 7.3 |
| 2014-15 | 2163.5 | 35.41 | 18527 | 21.39 | 8.5 |
| 2015-16 | 2208.6 | 35.05 | 18642.5 | 20.67 | 8.4 |
| 2016-17 (Provisional) | 2262.8 | 34.92 | 19686.9 | 21.20 | 8.7 |
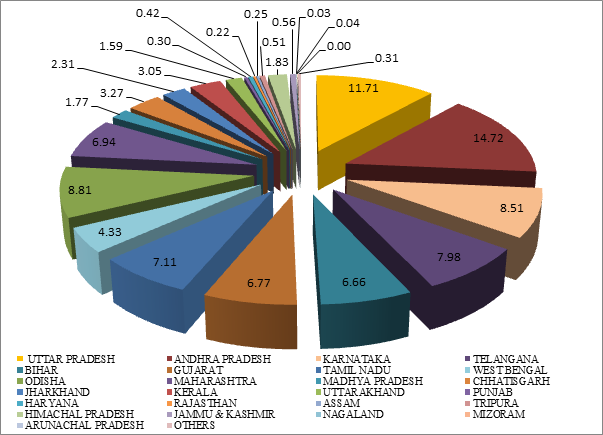
Fig 1. Per cent contribution of different states in total area under mango (2016-17) |

Fig-2. Per cent contribution of different states in total mango production (2016-17). |

Fig 3. Area (‘000 ha) covered under mango crop by different states (2016-17) |

Fig 4. Mango production (‘000 MT) by different states (2016-17). |
Uttar Pradesh was the leading mango producing state with contribution of 23.06 per cent of the total mango production whereas; Andhra Pradesh was the leading state in area by accounting for 14.72 per cent of total mango area under country in 2016-17 (Fig 1 & 2). In 2016-17, total mango production from Uttar Pradesh was 4540.23 thousand MT; while maximum area was reported in Andhra Pradesh (332.97 thousand ha) (Fig 3 & 4). The productivity of mango was also recorded highest in Uttar Pradesh (17.1 MT/ha) during 2016-17 (Table-3) which is also much higher than the national productivity (8.7 MT/ha) of mango. Andhra Pradesh, Telangana, Bihar, Maharashtra, Gujarat, Tamil Nadu, Odisha, Kerla and West Bengal were the other important states cultivating mango significantly and commercially. The States like Maharashtra contribute maximum towards export of mangoes from the country. States, like Karnataka and Andhra Pradesh are striving to increase their share in export by diversifying the export basket. A comparison of area and production of mango from 2014-15 to 2016-17 indicated that Uttar Pradesh was the leading mango producing state whereas, Andhra Pradesh was the leading mango producing state during 2014-15, 2015-16 and 2016-17.
Table 3: State-wise Area (‘000 ha), Production (‘000 MT) and Productivity (MT/ha) of Mango| States | 2014-15 | 2015-16 | 2016-17 | ||||||
| Area | Prod | Productivity | Area | Prod | Productivity | Area | Prod | Productivity | |
| UTTAR PRADESH | 250.74 | 4347.5 | 17.3 | 263.28 | 4512.71 | 17.1 | 264.93 | 4540.23 | 17.1 |
| ANDHRA PRADESH | 315.42 | 2822.08 | 8.9 | 327.31 | 2803.66 | 8.6 | 332.97 | 3163.32 | 9.5 |
| KARNATAKA | 175.41 | 1646.51 | 9.4 | 181.7 | 1725.67 | 9.5 | 192.61 | 1829.21 | 9.5 |
| TELANGANA | 196.44 | 1801.75 | 9.2 | 194.05 | 1778.32 | 9.2 | 180.62 | 1681.6 | 9.3 |
| BIHAR | 148 | 1272 | 8.6 | 149.14 | 1464.93 | 9.8 | 150.64 | 1479.58 | 9.8 |
| GUJARAT | 150.05 | 1219.71 | 8.1 | 153.18 | 1241.59 | 8.1 | 153.18 | 1241.59 | 8.1 |
| TAMIL NADU | 147.48 | 896.78 | 6.1 | 125.98 | 975.11 | 7.7 | 160.94 | 1156.99 | 7.2 |
| WEST BENGAL | 95.43 | 799.65 | 8.4 | 96.74 | 693.39 | 7.2 | 97.93 | 836.07 | 8.5 |
| ODISHA | 197.74 | 769.93 | 3.9 | 199.29 | 778.72 | 3.9 | 199.3 | 816.2 | 4.1 |
| MAHARASHTRA | 157.77 | 758.84 | 4.8 | 162.08 | 463.17 | 2.9 | 157.07 | 514.87 | 3.3 |
| MADHYA PRADESH | 26.71 | 396 | 14.8 | 27.89 | 371.48 | 13.3 | 40.08 | 494.36 | 12.3 |
| CHHATISGARH | 67.12 | 386.67 | 5.8 | 71.52 | 420.61 | 5.9 | 73.99 | 437.58 | 5.9 |
| JHARKHAND | 51.84 | 523.14 | 10.1 | 50.41 | 393.67 | 7.8 | 52.24 | 430.22 | 8.2 |
| KERALA | 44.85 | 252.86 | 5.6 | 70.12 | 382.52 | 5.5 | 69.11 | 382.38 | 5.5 |
| UTTARAKHAND | 40.7 | 150.62 | 3.7 | 35.91 | 149.73 | 4.2 | 35.93 | 149.76 | 4.2 |
| PUNJAB | 6.75 | 113.44 | 16.8 | 6.74 | 113.5 | 16.8 | 6.85 | 115.35 | 16.8 |
| HARYANA | 9.22 | 88.72 | 9.6 | 9.26 | 89.97 | 9.7 | 9.42 | 109.74 | 11.6 |
| RAJASTHAN | 5.45 | 78.68 | 14.4 | 5 | 82.27 | 16.5 | 5 | 82.5 | 16.5 |
| ASSAM | 4.59 | 45.69 | 10.0 | 4.62 | 46.15 | 10.0 | 5.58 | 58.49 | 10.5 |
| TRIPURA | 11.18 | 62.56 | 5.6 | 11.75 | 59.06 | 5.0 | 11.64 | 58.47 | 5.0 |
| HIMACHAL PRADESH | 41.11 | 47.61 | 1.2 | 41.52 | 37.63 | 0.9 | 41.52 | 47.4 | 1.1 |
| JAMMU & KASHMIR | 12.46 | 20.93 | 1.7 | 12.67 | 23.74 | 1.9 | 12.67 | 23.74 | 1.9 |
| NAGALAND | 0.51 | 3.57 | 7.0 | 0.57 | 3.74 | 6.6 | 0.64 | 4.19 | 6.5 |
| MIZORAM | 0.89 | 4.18 | 4.7 | 0.87 | 4.18 | 4.8 | 0.89 | 4.18 | 4.7 |
| ARUNACHAL PRADESH | 0.05 | 0.03 | 0.6 | 0.05 | 0.03 | 0.6 | |||
| OTHERS | 5.62 | 17.58 | 3.1 | 6.91 | 27 | 3.9 | 6.98 | 28.87 | 4.1 |
| TOTAL | 2163.47 | 18526.98 | 8.6 | 2208.56 | 18642.53 | 8.4 | 2262.77 | 19686.93 | 8.7 |
(Source : Indian Horticulture Database)